How to Read Code in Emacs
1. View
ID: 94a69f55-ee1b-4cbe-bbc9-b8de28b99273
PUBDATE: <2019-08-14 Wed 19:46>
1.1. Highlight Code
Attachments: highlight%20code.png
ID: 98ca483b-70bd-4a8b-b1b9-d604672fb8f3
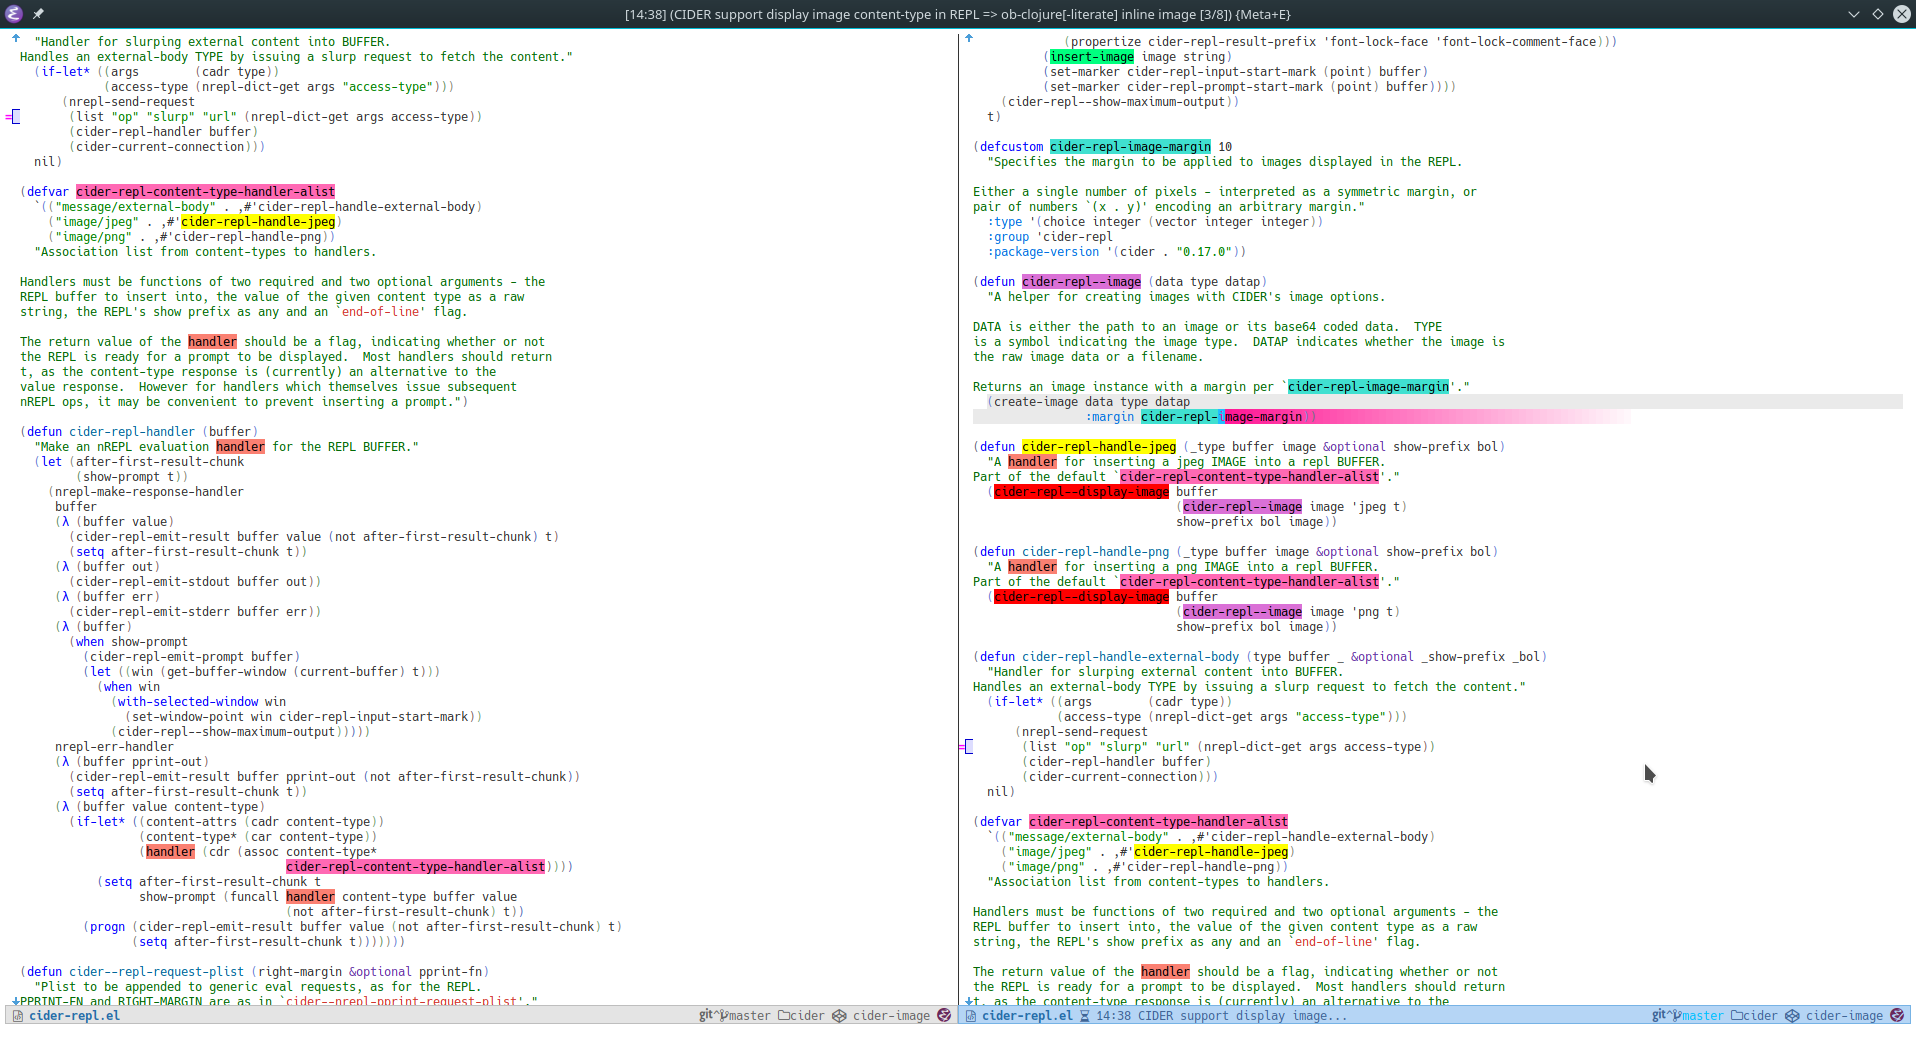
You can use highlighting tools to mark code with different colors like taking notes to distinguish code.
- I used Emacs package symbol-overlay or other similar highlighting packages.
2. Navigation
ID: 7e88b2b1-98a6-4813-b8be-5d2c8a33cdd5
PUBDATE: <2019-08-14 Wed 19:46>
2.1. Jump to definition of any code
ID: ecfb3da0-5777-4f50-bcbb-63318c9e3ccf
There are some options to select:
- Use text searching tools directly, Emacs
isearch,grep,ag,pt,rgetc. - If you want advanced text searching, can use "
regexpsearch", Emacs has built-in support, and has some packages to help you, even can use PCRE (Perl regexp) in Emacs with package "pcre2el". - In current buffer, you can use
Imenu, etc to jump. - Or even open an class/functions definitions sidebar to have an overview of your code.
2.2. Jump to definition of thing-at-point
ID: 3879abc2-861c-407e-9cab-bd08ed1fe9cd
When code definition is not in the same window page area, you want to jump to definition.
You can use xref.el (which is Emacs built-in support now). If you want to keep current
code viewing, you can create a function to accept universal prefix argument
C-u for [M-.] to open code definition in other window. If you don't
want to mess your windows up, you also can try Emacs new feature (from 26?) "child-frame".
There is an existing package called "posframe" can be helpful.
3. Figure out of Code by running it
Attachments: Edebug%20result%20at%20point.png
ID: 6c961996-eff9-41fa-a420-9272520996af
PUBDATE: <2019-08-14 Wed 19:46>
Sometimes I can't understand the code by reading, then I try to run code with debugger/tracer.
For example, Elisp code, Emacs has built-in tool Edebug.
Because Edebug show stop point result in echo-area (minibuffer). It is not convinient for me. I want it displayed at point.
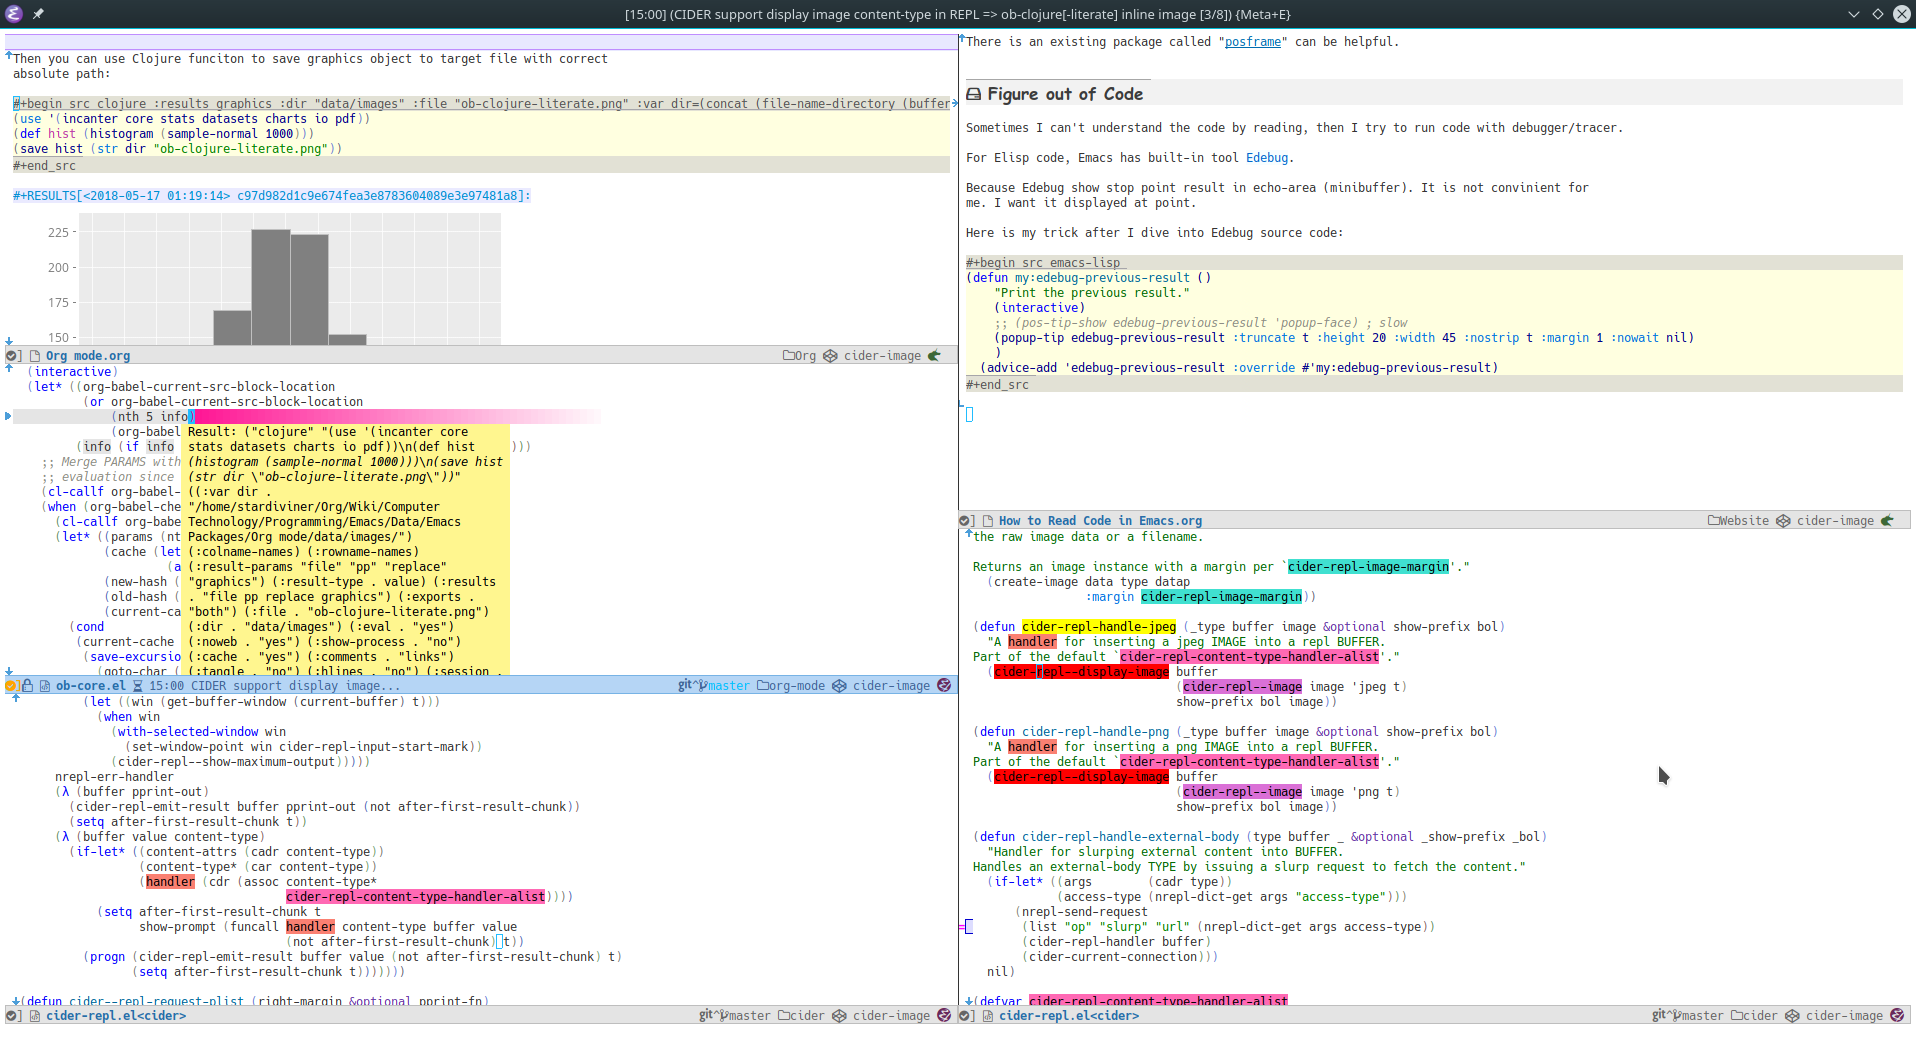
Here is my trick after I dive into Edebug source code:
(defun my:edebug-previous-result ()"Print the previous result."(interactive);; (pos-tip-show edebug-previous-result 'popup-face) ; slow(popup-tip edebug-previous-result :truncate t :height 20 :width 45 :nostrip t :margin 1 :nowait nil))(advice-add 'edebug-previous-result :override #'my:edebug-previous-result)
Tip: Sometimes edebug will auto scroll down, when stop point moves to bottom of window,
the result popup is truncated, you can use C-l (recenter-top-bottom)
to recenter window. Then redisplay result popup with [r].
About other programming languages, like C, C++, there are tools for static diagnostic as @MaskRay wiki mentioned, and dynamic diagnostic like cgdb (@MaskRay mentioned).
More programming languages has more relative tools. I will not list them one by one at here. Just give out some examples that wish can inspire you. That's all.
4. TODO Will add more tricks here in future
ID: d2ef0e02-e352-4728-b9f8-1d44f8a6cc9a
PUBDATE: <2019-08-14 Wed 19:46>
- State "TODO" from
Record to My Org node "Read Code" too.